Microservices: Observability Patterns
What are Observability Patterns?
Observability techniques provide visibility into the distributed system, allowing developers to better understand how their applications work. Observability provides the required control to identify and resolve issues quickly
Three Pillars of Observability
The following are the three Pillars of Observability:
- Logs
- Metrics
- Traces
Essential Observability Patterns
The following are the Essential Observability Patterns for Comprehensive Microservice Monitoring:
- Log aggregation
- Application metrics
- Exception tracking
- Health check API
- Audit logging
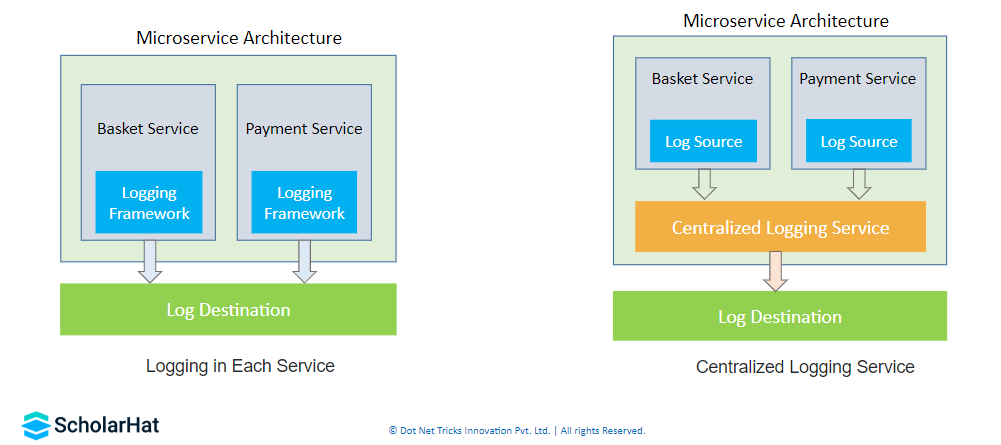
Microservices Logging
Microservices logging is the process of monitoring and recording the activity of specific services in a distributed microservices architecture.

Frameworks used to implement Observability patterns
Observability patterns can be implemented using the following frameworks:
- ELK Stack
- Open Telemetry
Logging with ELK Stack
ELK is a set of three open-source apps from Elastic - Elasticsearch, Logstash, and Kibana - that receive data from any source or format and then allow you to search, analyze, and visualize it.

Open Telemetry
OpenTelemetry is a cloud-native observability framework that simplifies the instrumentation, generation, collection, and export of telemetry data (metrics, logs, and traces) for analysis, supports multiple .NET versions, and improves understanding of program performance and behavior.


